Neighborhood Change in Salt Lake City
COMMUNITY COUNCIL DISTRICTS | 1970 - 2010
The Socioeconomic Change of Salt Lake City Community Council Districts is a report summarizing the neighborhood change in Salt Lake City between 1970 and 2010. The study makes use of a Gentrification Index to quantify the changed characteristics in each neighborhood. Using key indicators, the index measures how much a neighborhood's aggregate socioeconomic status has changed over the time period
This study shows that inequality and socioeconomic polarization is increasing in Salt Lake City. Some neighborhoods have grown wealthier, while others have grown poorer. At the same time, the number of middle-class neighborhoods has decreased.
An accompanying Appendix, shows detailed quantitative and qualitative information for each neighborhood in Salt Lake City.
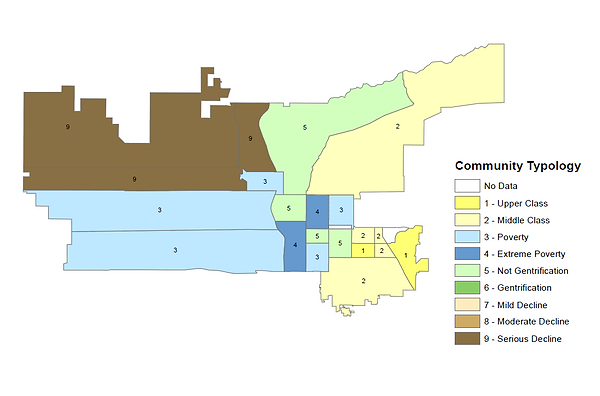
The Community Typology displayed on the map above, shows neighborhood change based on community area scores from 1970 to 2010. Some neighborhoods are stable and did not change. Others increased in socioeconomic status, while many decreased in socioeconomic status.
The Community Area Score, visualized on the map to the left, shows the Gentrification Index score for each neighborhood by decade. The darker areas of the map show neighborhoods with higher socioeconomic status. The lighter areas show neighborhoods with lower socioeconomic status.
As you click the image, it shows the upgrading and decline of different neighborhoods in each decade from 1970 to 2010.